
Ecommerce email marketing KPIs
Understand what each KPI measures, how to calculate it and how to use it without confusing attribution with incremental impact.
 By Dídac Anton
Define a KPI before setting its target
A rate without a denominator can lead to the wrong decision. Agree what is counted, for which population, over what period and under which rules. “Conversion” might mean unique buyers, orders or sessions ending in a purchase; these measures are not interchangeable.
Record source, numerator, denominator, period, filters and owner. Specify unique people versus total events, currency and treatment of returns and cancellations. Keep the extraction date too: delayed data can change a report.
Start with a few measures connected to decisions. For campaign management, separate sending health, response and commercial outcomes. Many numbers cannot replace a clear question about what to keep, fix or test.
Formulas for an individual campaign
These explicit conventions describe one campaign with one message per recipient. Do not assume they match every tool report. Klaviyo documents an attributed order rate and revenue per recipient, for example; check the exact selected metric.
| Proposed metric | Calculation | Interpretation |
|---|---|---|
| Recorded delivery | Delivered messages / sent messages × 100. | Recorded delivery, not reading. |
| Unique click rate on delivered | People with a click / delivered recipients × 100. | Recorded response; check automated activity. |
| Attributed buyer rate | Unique attributed buyers / delivered recipients × 100. | One person counts once even with several orders. |
| Attributed order rate | Attributed orders / delivered recipients × 100. | Orders can differ from buyers. |
| Attributed revenue per recipient | Attributed revenue / delivered recipients. | An average amount under the selected model. |
| Unsubscribe rate on delivered | People unsubscribing / delivered recipients × 100. | Observe the cost of continued contact. |
| Recorded open rate | People with a recorded open / delivered recipients × 100. | Not necessarily human reading. |
| Clicks over recorded opens | People with a click / people with a recorded open × 100. | Depends on the quality of both records. |
With a zero denominator, report “not calculable”, not 0%. Show counts alongside rates. For reports covering several messages, state how recipients are repeated or deduplicated.
Worked example using fictional data
This educational example is not an Abalola result or performance benchmark. A campaign records 1,000 delivered recipients, 50 people clicking, 10 attributed buyers, 12 attributed orders and €600 attributed revenue.
| Question | Calculation | Result |
|---|---|---|
| What proportion clicked? | 50 / 1,000 × 100 | 5% |
| What proportion bought under attribution? | 10 / 1,000 × 100 | 1% |
| How many orders per hundred recipients? | 12 / 1,000 × 100 | 1.2 |
| Attributed revenue per recipient? | €600 / 1,000 | €0.60 |
A 1% buyer rate and 1.2% order rate are consistent: some buyers ordered more than once. They do not prove that email alone caused €600 of sales. Interpret the unit before judging the outcome.
Automatic opens and bot clicks
Klaviyo can identify events flagged as Apple Mail Privacy Protection opens. Automatic opens can inflate engagement analysis based on opens alone.
Its documentation also identifies bot clicks: automated systems may access links for security checks or previews. A recorded click does not always demonstrate human interest.
Before declaring a better subject line or design, compare filters across periods. Record a change in bot or open treatment as a measurement change. Look for coherent later signals, such as browsing or purchase, without treating one signal as certainty.
For segmentation, avoid defining interest through a single open. Activity can guide a hypothesis but needs context. Record when group criteria change so sudden shifts can be explained.
Attribution is different from incremental impact
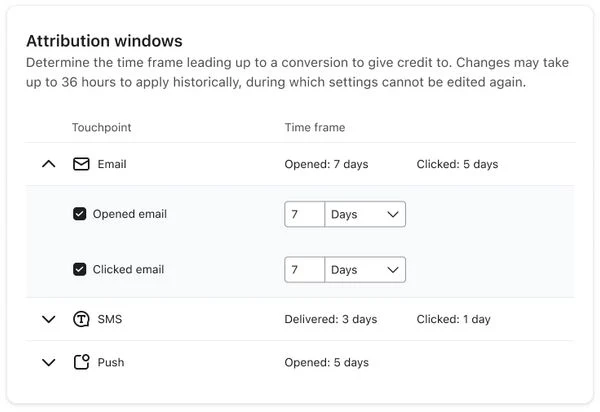
Klaviyo allows changes to attribution windows and eligible interactions, including exclusions for certain automated activity. Keep the settings used when reporting an outcome.
Its documentation distinguishes last touch, crediting the final touchpoint, from linear attribution, distributing credit across eligible touchpoints. These are credit-allocation rules.
Separate observed sales, attributed sales and estimated uplift over what would have happened without the action. Changing a window can alter reported credit without changing actual store orders. Reconcile orders before adding attributed revenue from different tools.
To study uplift, design an appropriate control comparison and define population, assignment, observation period and outcome beforehand. Consider uncertainty and interference between groups. A before/after comparison alone is not causal proof when promotions, traffic or availability also changed.
Attributed revenue is not profit. Profitability analysis needs costs and margins aligned with the question and a defensible effect estimate. If these are missing, label attributed revenue and its limits rather than renaming it incremental return.
Compare retention with equal observation time
Klaviyo offers cohort analysis to follow groups of profiles over time. Its value is in comparing clearly defined groups and periods.
As an analysis proposal, group customers by first-purchase month and measure who returns within a fixed window. In a fictional example, 24 of 120 first-time buyers purchase again within 60 days: observed repeat purchase is 20%. This describes that cohort and window, not a universal rate.
Do not compare this mature cohort with customers only ten days after their first purchase. Do not confuse repeat purchase with subscription retention or pool categories with very different cycles without checking their composition.
The customer retention guide connects this analysis to customer support and follow-up. Separate observed outcomes from programme impact: a better cohort may coincide with product, acquisition or service changes.
Turn a metric into the next check
A change tells you where to investigate, rarely its cause by itself. This table proposes checks before intervention:
| Signal | What to compare | Next work |
|---|---|---|
| Delivery falls | Provider, errors, contact source and recent changes. | Review deliverability. |
| Opens rise without other actions | Filters, automated activity, audience and period. | Validate measurement before changing content. |
| Clicks but few purchases | Destination, availability, price and checkout friction. | Reproduce the recipient journey. |
| Unsubscribes rise | Frequency, expectations and overlapping messages. | Review calendar and recipients. |
| Attributed revenue rises, total sales do not | Model, window and orders claimed across channels. | Reconcile attribution with store sales. |
| Repeat purchase falls | Cohort maturity, categories and incidents. | Review experience and post-purchase. |
When several measures change together, an audit can prioritise hypotheses and dependencies. Define the change, expected signal and review point. Avoid changing audience, offer and design together if you need to understand what influenced results.
A short report that supports decisions
Do not average rates without considering their weights. In another fictional example, 50 clicks over 1,000 deliveries and 180 over 9,000 produce 230 / 10,000 = 2.3% across those records. The simple average of 5% and 2% is 3.5% and answers a different question. A person appearing in both campaigns is not deduplicated by this aggregate.
Compare equivalent audiences, seasons, offers and observation periods. External benchmarks can prompt questions but cannot replace your history or prove improvement. Show counts with small samples and avoid declaring a winner from a tiny difference.
- Business objective and reporting question.
- Period, extraction date and source.
- Numerators, denominators and counting rules.
- Attribution settings and automated-activity filters.
- Relevant comparison and known limitations.
- Prioritised hypothesis and one concrete action.
- Owner and review date.
A useful report supports a decision proportionate to the evidence, including investigating further or waiting for more data. An impressive number without a definition cannot improve the programme.
Sources and further reading
AI-assisted translation
Article by Dídac Anton. The English, German, Dutch and French versions were translated from Spanish with the help of AI.
Read the Spanish originalRecommended articles

Ecommerce email segmentation
Turn segmentation into useful rules for deciding what to send, to whom, when and why.

Post-purchase email sequence
Connect the post-purchase experience to useful information, reviews and future purchases while respecting the real order status.

Ecommerce email marketing guide
A practical ecommerce email guide: what to build first, how the pieces connect and what to measure at each stage.